State Street vs American Funds: Two Different Target-Date Businesses
https://staging.axiomaticdata.com/blogPosts/state-street-vs-american-funds-401-k-market-strategies
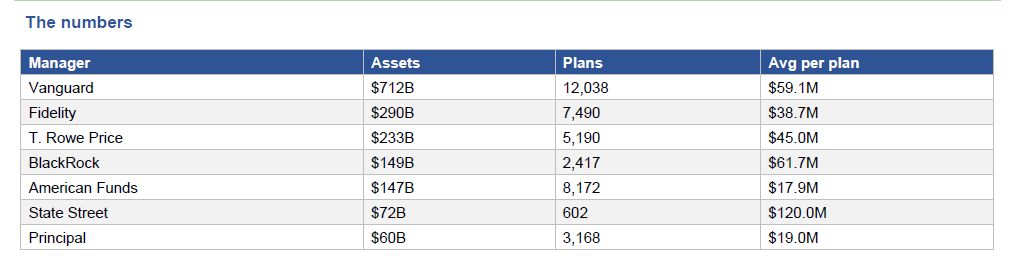
Ranking managers by assets hides a more interesting fact: they aren't competing for the same customers. In large 401(k) plans, State Street manages $134 billion of target-date money across 380 plans, about $352 million per plan. American Funds manages $114 billion across 6,270 plans, about $18 million per plan. That is 16 times the reach for slightly less money.
Where each firm's plans sit
| Plan assets | State Street plans | State Street dollars | American Funds plans | American Funds dollars |
|---|---|---|---|---|
| Under $25M | 68 | Under $1B | 3,846 | $20B |
| $25M to $100M | 88 | $3B | 1,858 | $35B |
| $100M to $250M | 49 | $4B | 386 | $24B |
| $250M to $1B | 96 | $21B | 165 | $28B |
| Over $1B | 79 | $105B | 15 | $7B |
78% of State Street's target-date money is in 79 plans with more than $1 billion each. 61% of American Funds' plans have less than $25 million.
Two business models
State Street sells index target-date strategies as collective trusts (100% of its target-date money here), usually through institutional consultants to the largest employers. American Funds sells actively managed mutual fund series (virtually none in trusts), distributed through financial advisers to small and mid-sized employers. A league table by assets makes them look like rivals. In practice, they barely meet.
About the data
Figures cover 401(k) plans with more than 100 participants that list their holdings on Schedule H of Form 5500, for plan year 2024 (52,763 plans). Dollars are the plans' holdings in mutual funds, collective investment trusts (CITs) and pooled separate accounts on the Schedule of Assets Held.
Every plan, fund and manager behind these numbers is in Axiomatic Plan Intelligence. For more information, email us at info@axiomaticdata.com.
Updated November 2026 with figures from the latest complete plan year (2024). The original LinkedIn post used an earlier version of our data, so some numbers differ.
Originally posted on LinkedIn.