Latest News
How Fast the CIT Wrapper Is Spreading Inside Existing 401(k) Plans
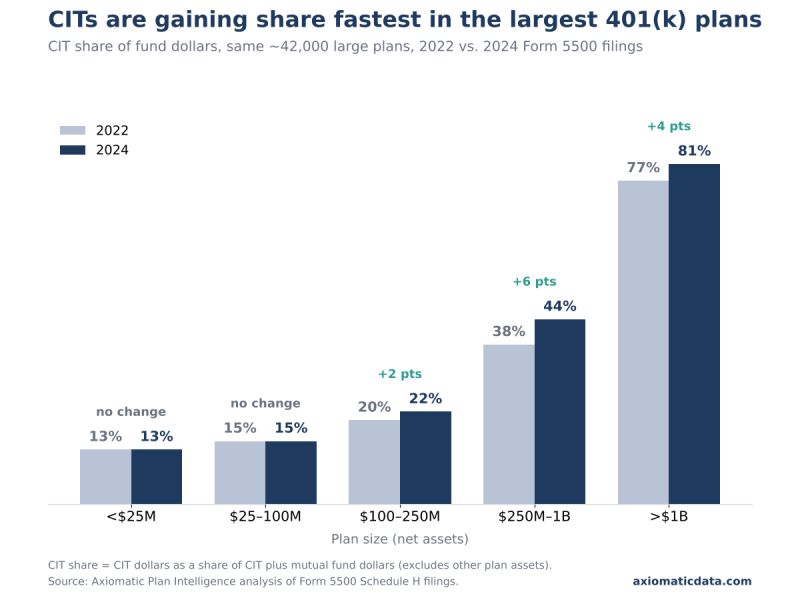
Most CIT market-share figures compare one year's universe of plans with another's, so new plans, closed plans and plans crossing size thresholds all blur the trend. We took a different approach: we followed the same 42,000 large 401(k) plans from their 2022 Form 5500 filings to their 2024 filings, so every change below happened inside a plan that existed in both years.
The headline
Inside those plans, collective investment trusts (CITs) went from 57% to 61% of fund dollars in two years. About 2,300 plans added their first CIT; about 1,000 dropped them.
The move is all at the top
| Plan size | CIT share, 2022 | CIT share, 2024 |
|---|---|---|
| Over $1 billion | 77% | 81% |
| Over $250 million | 38% | 44% |
| Under $25 million | 13% | 13% |
Large plans have the scale to negotiate a CIT's lower, customized fees, and their committees and consultants are set up to review a trust's declaration and fee schedule. Small plans mostly buy what their recordkeeper's platform offers, and for many of them that is still a mutual fund menu.
Target-date funds are where the switch shows up
Target-date funds are the biggest line on most 401(k) menus, because they are usually the plan's default investment. Among plans that changed the wrapper on a target-date series, 522 moved from mutual fund to trust against 135 the other way. About three-quarters were the same manager re-papering the same strategy: the glide path stayed, and the plan moved to the cheaper vehicle.
That matters for what comes next. When a plan re-papers its default fund as a CIT, it has already accepted a trust as the home for its largest pool of participant money.
The recordkeeper shapes the pace
On a slightly broader panel of plans that filed holdings in both years, the CIT share rose at nearly every major recordkeeper, but by very different amounts and from very different starting points.
| Recordkeeper (2024) | CIT share, 2022 | CIT share, 2024 | Change |
|---|---|---|---|
| Fidelity | 57.5% | 62.2% | +4.7 pts |
| Empower | 48.2% | 51.7% | +3.5 pts |
| Vanguard | 57.3% | 60.7% | +3.4 pts |
| Principal | 42.9% | 46.1% | +3.2 pts |
| Transamerica | 24.1% | 26.8% | +2.7 pts |
| John Hancock | 15.8% | 17.0% | +1.2 pts |
| Voya | 75.2% | 76.2% | +1.0 pts |
| ADP | 12.9% | 12.6% | -0.3 pts |
The platforms serving larger plans moved most. Platforms built around small-plan, mutual-fund menus barely moved, which matches the size pattern above.
Why a trust, and why it matters for alternatives
A CIT is a pooled fund maintained by a bank or trust company. It is regulated by banking authorities rather than registered with the SEC like a mutual fund, which typically means lower costs and more flexibility on fees and structure. Most 403(b) plans still can't use them broadly, which is one reason the shift shows up most clearly in 401(k)s.
That flexibility is why so many DC alternatives products are being built as trusts: a CIT can combine a private-market sleeve with daily-valued public holdings in a single vehicle, inside a structure large plans already use for their default fund.
For anyone building an alternatives product for DC: the wrapper the industry is standardizing on is a trust, and the plans adopting it fastest are the large ones that could hold a private sleeve.
About the data
Figures come from Schedule H filings for 401(k) plans with more than 100 participants, matched by plan sponsor EIN and plan number across 2022 and 2024. Shares are of dollars in mutual funds, CITs and pooled separate accounts on the Schedule of Assets Held. Recordkeepers are inferred from Schedule C and other filing data.
Every plan, fund, manager and recordkeeper behind these numbers is in Axiomatic Plan Intelligence. For more information, email us at info@axiomaticdata.com.
Originally posted on LinkedIn.
Finding the Wealthiest 401(k) Participants With a Self-Directed Account
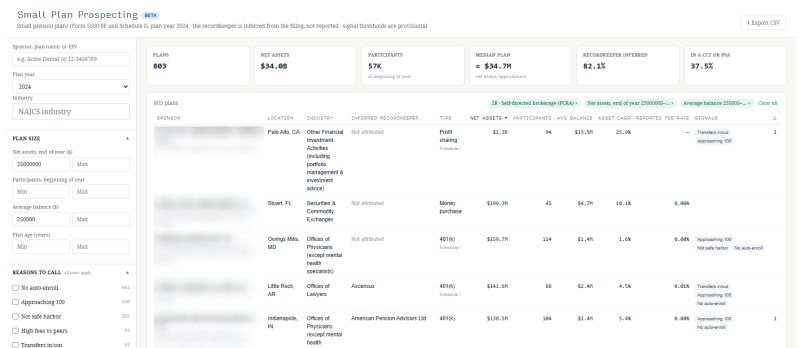
In Form 5500 data for plan year 2024, we started with every plan filing as a small plan, on Form 5500-SF or the full form with Schedule I. We kept those with at least $25M in assets and an average balance of at least $250,000, then filtered for those that report a brokerage window.
That leaves 803 plans, about 57,000 participants, and $34 billion. The average participant holds roughly $600,000. Of the 803, 752 are 401(k) plans.
How the list narrows
| Filter | Plans | With a brokerage window | Share |
|---|---|---|---|
| All small-plan filers | 807,028 | 71,785 | 8.9% |
| $25M+ in assets | 2,372 | 836 | 35.2% |
| $25M+ and $250K+ average balance | 2,150 | 803 | 37.3% |
Who they are
Most of these are physician groups, law firms and investment managers.
| Industry | Plans at $25M+ / $250K+ | With a window | Assets in those plans |
|---|---|---|---|
| Offices of physicians and dentists | 480 | 303 | $13.0B |
| Legal services | 450 | 231 | $9.1B |
| Securities and other financial investments | 241 | 83 | $4.8B |
| Offices of other health practitioners | 28 | 18 | $0.8B |
Those four groups account for 635 of the 803 plans and about 80% of the assets. Physician practices stand out: 63% of the qualifying plans have a window, compared with 37% for the group as a whole.
The participants are also the partners. They are the sponsor, the fiduciary, and the client, with no committee in between.
Windows get more common as plans get bigger
| Plan assets | Plans with a brokerage window |
|---|---|
| Under $1M | 7.6% |
| $1M to $5M | 9.9% |
| $5M to $25M | 14.6% |
| $25M and up | 35.2% |
Where the plans sit
| Inferred recordkeeper | Plans | Assets |
|---|---|---|
| Fidelity | 148 | $6.1B |
| Ascensus | 66 | $2.7B |
| Schwab | 39 | $1.8B |
| ABA Retirement Funds | 19 | $0.6B |
| OneAmerica | 16 | $0.7B |
| Not attributed | 144 | $7.4B |
Recordkeepers are inferred, not reported on the filing, and 144 plans could not be attributed.
Three typical plans
| Physician group | Law firm | Investment manager | |
|---|---|---|---|
| Plan assets | $30–40M | $30–40M | $30–40M |
| Participants | 60–70 | 65–75 | 50–60 |
| Average balance | $450–500K | $500–550K | $600–650K |
| Asset growth per year, 3 years | About 3–4% | About 2–3% | About 5–6% |
| Employer contribution per active participant | About $16K | About $11K | About $31K |
| Recordkeeper | Large national | Mid-size national | Large national |
| Region | West | Midwest | Mid-Atlantic |
What this does and doesn't show
If you already manage a surgeon’s or a partner’s taxable assets, their plan balance may be reachable through that window. If you run interval or liquid alternative funds, the same door applies. A reported window doesn't tell us how much money sits in it, and which funds are available depends on the window's provider.
Every sponsor, plan, inferred recordkeeper and reason to call is in Axiomatic Plan Intelligence. Ask for more information at info@axiomaticdata.com. DCALTA - Defined Contribution Alternatives Association is coming up November 10.
Originally posted on LinkedIn.
3,600 Large 401(k) Plans Have the Scale for Alternatives
https://staging.axiomaticdata.com/blogPosts/3-600-large-401-k-plans-have-the-scale-for-alternatives
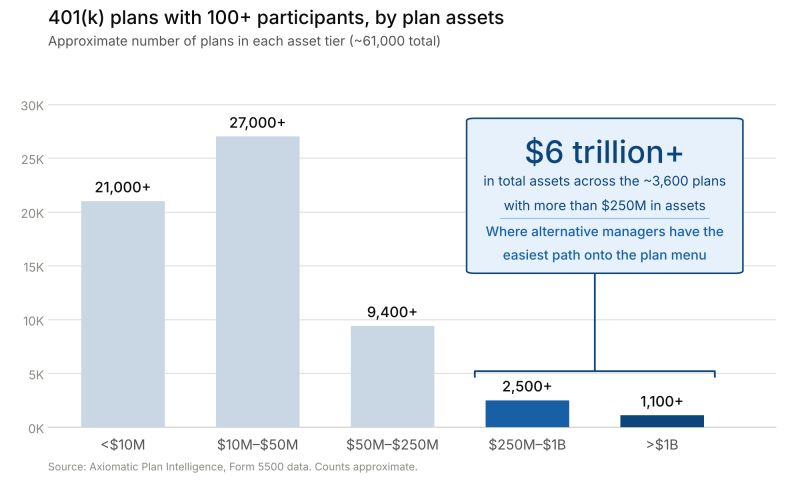
If you're an alternatives manager trying to analyze or segment the defined contribution market, start here: about 3,600 401(k) plans with more than 100 participants hold more than $250 million each, and together they hold about $6 trillion. They have the scale to absorb an alternative option and the governance budget to evaluate one.
The top of the market
| Plan assets | Plans | Total assets | Participants |
|---|---|---|---|
| $250M to $1B | 2,458 | $1.2T | 11.4M |
| Over $1B | 1,126 | $4.8T | 31.0M |
| Over $250M | 3,584 | $6.0T | 42.4M |
| Under $250M | 49,413 | $1.6T | 23.5M |
Fewer than 7% of large 401(k) plans hold almost 80% of the assets. Counts are for plans that list their holdings.
What they look like
| $250M to $1B | Over $1B | |
|---|---|---|
| Offer a brokerage window | 38% | 51% |
| Use automatic enrollment | 61% | 65% |
| Median funds on the menu | 28 | 28 |
| Already hold a private alternative | 40 | 41 |
These plans already run institutional menus: collective trusts hold 43% of fund dollars in plans of $250 million to $1 billion and 79% in plans over $1 billion. Very few hold a private alternative yet: 81 of the 3,584, about 2%.
Who serves them
| Inferred recordkeeper | Plans over $250M | Their assets |
|---|---|---|
| Fidelity | 1,445 | $2.55T |
| Empower | 440 | $0.56T |
| Vanguard | 333 | $0.52T |
| Principal | 230 | $0.19T |
| Schwab | 215 | $0.22T |
| T. Rowe Price | 167 | $0.21T |
| Merrill / Bank of America | 108 | $0.18T |
Fidelity alone serves 40% of these plans and more than 40% of their assets. Any alternatives product aimed at the top of the market has to work on Fidelity's platform.
Which industries
Manufacturing sponsors the most of these plans (967 plans, $1.8 trillion), followed by professional, scientific and technical services (622), finance and insurance (459) and health care (309).
How to use it
Axiomatic Data can identify every one of these plans, along with their recordkeeper, adviser and current fund menu, and whether they already hold an alternative.
About the data
Figures cover 401(k) plans with more than 100 participants that list their holdings on Schedule H of Form 5500, for plan year 2024, excluding multiemployer plans. Recordkeepers are inferred from Schedule C and other filing data.
For more information, email us at info@axiomaticdata.com. The DCALTA (Defined Contribution Alternatives Association) conference is November 10 in New York City.
Originally posted on LinkedIn.
Private Real Estate in 401(k) Plans: The Wrapper Did the Work
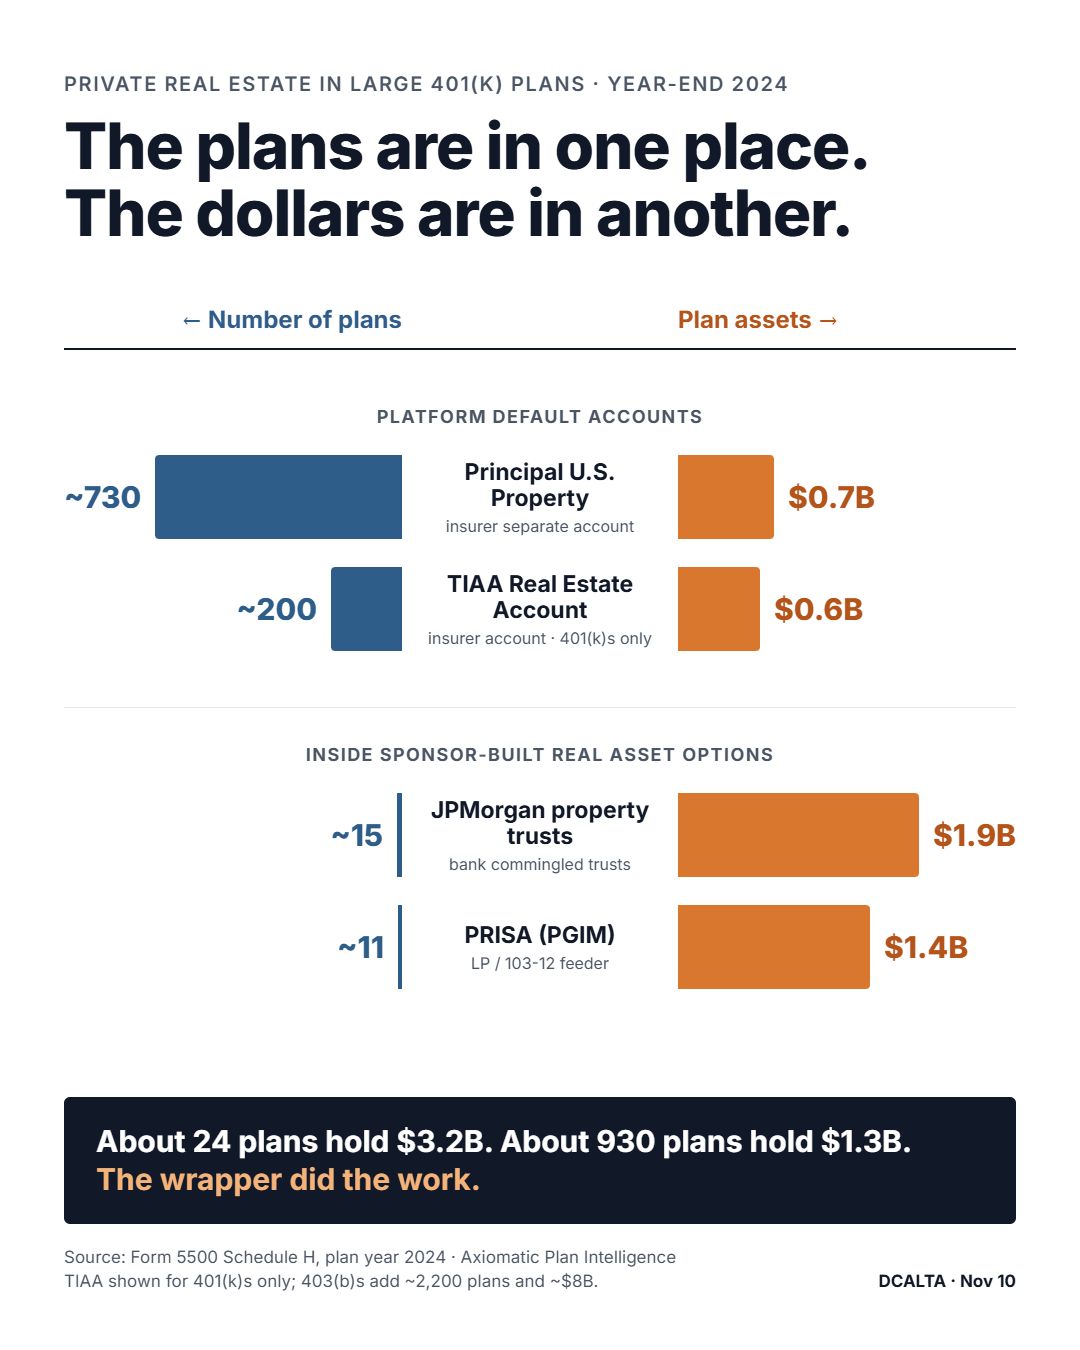
About 1,000 large 401(k) plans held a private real estate vehicle at the end of 2024, by the plans' own Form 5500 filings. But the plans and the dollars sit in different places.
Most plans came through a platform default
Most of the plans got there through an insurer's real estate account that comes with the recordkeeper's menu. Principal U.S. Property appears in 685 plans and the TIAA Real Estate Account in 131: between them, roughly 800 plans and about $1.3 billion, under $2 million a plan.
These are pooled separate accounts: insurance-company products that value daily, so they can sit on a participant menu like any other fund. Plans on Principal's recordkeeping platform hold the Principal account at about 13%, and plans on TIAA's at about 75%. Across the other major recordkeepers, fewer than 1% of plans hold any private real estate.
Most of the dollars sit in a few very large plans
| Plan assets | Plans holding private real estate | Private real estate dollars |
|---|---|---|
| Under $25M | 527 | $0.09B |
| $25M to $250M | 403 | $0.31B |
| $250M to $1B | 40 | $0.20B |
| Over $1B | 40 | $3.34B |
Forty plans with more than $1 billion each hold 85% of the private real estate money. Many of them built their own real-asset option and put a bank property trust, usually one of JPMorgan's commingled property trusts, or a PGIM real estate feeder fund inside it.
| How it's held | Plans | Dollars |
|---|---|---|
| Insurance pooled separate accounts | 931 | $1.57B |
| Bank collective trusts | 30 | $1.99B |
| Other partnership and fund interests | 44 | $0.37B |
Few plans picked a fund on their own
Fewer than 100 plans chose a private real estate fund on their own, rather than taking what their platform offered.
What it means for product builders
For anyone building a private real estate product for DC, the committees that said yes did it in one of two ways: through an insurer account on their recordkeeper's platform, or through a bank trust inside a daily-valued menu option such as a real-assets fund or a custom target-date fund. Either way, the wrapper did the work.
One caution on the count: about 70 of these plans hold Principal's and another insurer's "global real estate" accounts, which may hold listed real estate securities rather than private property. The private real estate count is closer to 950 without them.
This may also interest the Defined Contribution Real Estate Council and the Defined Contribution Institutional Investment Association (DCIIA).
About the data
Figures cover 401(k) plans with more than 100 participants that list their holdings on Schedule H of Form 5500, for plan year 2024, excluding multiemployer plans. Recordkeepers are inferred from Schedule C and other filing data.
For more information, email us at info@axiomaticdata.com. The DCALTA (Defined Contribution Alternatives Association) conference is November 10 in New York City.
Originally posted on LinkedIn.
CITs Are Setting the Stage for Alternatives in 401(k) Plans
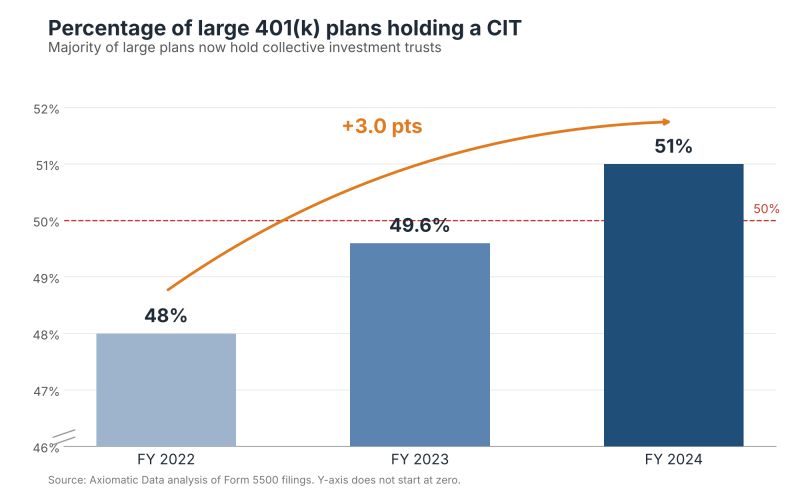
Asset managers are increasingly building alternatives for 401(k) plans as collective investment trusts (CITs), and the plumbing is already in place. Among 401(k) plans with more than 100 participants whose filings list their holdings, more than 27,000 held at least one CIT in 2024, about half, up from 48% in 2022. And nearly half of everything these plans list, some $3.7 trillion, now sits in CITs, up from 44% two years earlier.
The share of plans holding a CIT keeps rising
We looked at 53,309 401(k) plans with more than 100 participants whose 2024 Form 5500 Schedule H lists their investments. Of these, 27,213 (51%) held at least one CIT. That share has grown each year:
| Plan year | Plans holding a CIT | CIT share of listed holdings |
|---|---|---|
| 2022 | 48.0% | 44.4% |
| 2023 | 49.6% | 46.2% |
| 2024 | 51.0% | 48.7% |
The plans that hold a CIT have $6.77T in total assets. Across all the plans we looked at, $3.73T of listed holdings sits in CITs, close to half. The dollar share is rising faster than the plan count, so plans that already use CITs are putting more money into them.
Why this matters for alternatives
A plan that already holds a CIT has done the work a new one requires: its fiduciaries have reviewed a non-registered vehicle and its recordkeeper can trade and value it. That lowers the cost of adding a CIT that includes private real estate, private credit or infrastructure. Many asset managers building DC alternatives are using the CIT structure for this reason.
The adoption figures need some context, though. About 9,900 of the plans that hold a CIT hold only a stable-value or cash CIT. Those are often chosen by the recordkeeper and not as a deliberate investment decision. About 17,300 plans use CITs for their core investment lineup, and those plans are the clearer opening for an alternatives CIT.
Where alternatives sit today
Private alternatives are still rare. Only about 1,000 of the 53,309 plans hold any private real estate, infrastructure or credit. Most of that exposure is in insurance-company separate accounts, mainly Principal U.S. Property and the TIAA Real Estate Account:
| How it’s held | Plans | Assets |
|---|---|---|
| Insurance separate accounts | 927 | $1.64B |
| CITs | 37 | $2.03B |
Today, alternatives held in CITs reach few plans but carry more money per plan. If CITs keep spreading at their current pace, that may change.
Methodology
Our source is Form 5500 Schedule H filings (U.S. Department of Labor) for 401(k) plans with more than 100 participants that list their holdings. Plan years run 2022–2024. We identify CITs from the filed holdings, and we classify stable-value and cash CITs from fund names, so those counts are approximate.
Want to learn more? Email info@axiomaticdata.com.
Originally posted on LinkedIn.
We Built a Retirement Age Map of America From 401(k) Balances
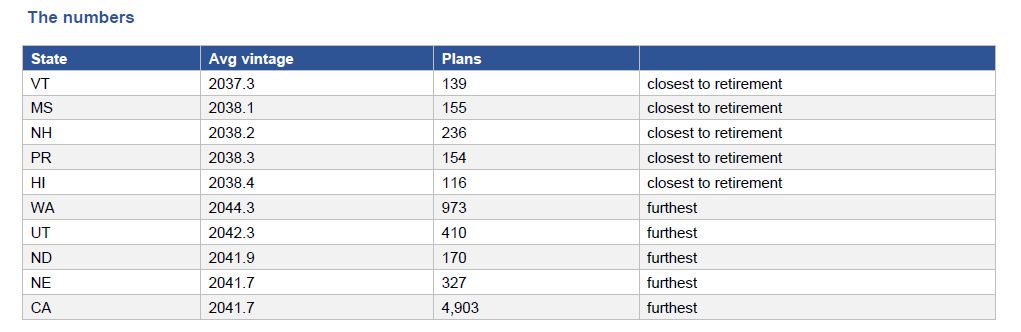
Where a plan's money sits on the glide path is a measure of its workforce. For each plan, we compute the asset-weighted average target-date vintage: a plan concentrated in 2030 funds has a workforce much closer to retirement than one concentrated in 2055. Rolled up by state, the result is a demographic map derived entirely from fund balances.
The oldest and youngest states
| Oldest (earliest average vintage) | Average vintage | Youngest (latest average vintage) | Average vintage |
|---|---|---|---|
| Vermont | 2037.2 | Washington | 2044.0 |
| Mississippi | 2037.9 | California | 2042.5 |
| Hawaii | 2038.3 | North Dakota | 2041.6 |
| Alaska | 2038.3 | Oklahoma | 2041.5 |
| New Hampshire | 2038.5 | Utah | 2041.4 |
| Rhode Island | 2038.9 | Nebraska | 2041.3 |
States with at least 60 plans holding target-date funds.
How well it tracks
Several results line up with Census age data, though no demographic data entered the calculation. Vermont and New Hampshire, which this measure puts among the oldest, are among the oldest states by median age; Utah, among the youngest here, is the youngest by Census.
What it actually measures
The map reflects where plan sponsors are headquartered, not where every employee lives. Washington and California rank youngest partly because large technology employers with young workforces file from there. The measure also reflects people who save in target-date funds, so plans that default participants into another investment count less.
Why it matters
The same calculation works for a single plan. A plan's average vintage is a quick read on how close its participants are to retirement, which shapes its likely interest in retirement income options, its future outflows, and which products are relevant to it.
About the data
Figures cover 401(k) plans with more than 100 participants that list their holdings on Schedule H of Form 5500, for plan year 2024 (52,763 plans). Dollars are the plans' holdings in mutual funds, collective investment trusts (CITs) and pooled separate accounts on the Schedule of Assets Held.
Every plan, fund and manager behind these numbers is in Axiomatic Plan Intelligence. For more information, email us at info@axiomaticdata.com.
Updated November 2026 with figures from the latest complete plan year (2024). The original LinkedIn post used an earlier version of our data, so some numbers differ.
Originally posted on LinkedIn.
T. Rowe Price Runs the Largest Target-Date Trusts
https://staging.axiomaticdata.com/blogPosts/t-rowe-price-holds-america-s-largest-target-date-funds

Vanguard manages three times more target-date money than T. Rowe Price inside large 401(k) plans: $916 billion against $291 billion. Its mutual funds are the largest single target-date funds of all, with the Vanguard Target Retirement 2030, 2035 and 2040 funds each holding more than $31 billion across about 9,300 plans.
Among collective trusts, though, the largest individual target-date funds are T. Rowe's.
| Fund | Vehicle | Dollars | Plans |
|---|---|---|---|
| T. Rowe Price Retirement 2040 Trust | CIT | $25.1B | 814 |
| T. Rowe Price Retirement 2030 Trust | CIT | $25.1B | 817 |
| T. Rowe Price Retirement 2035 Trust | CIT | $23.5B | 806 |
| T. Rowe Price Retirement 2045 Trust | CIT | $20.8B | 814 |
| Vanguard Target Retirement 2040 Trust II | CIT | $20.2B | 636 |
| Vanguard Target Retirement 2045 Trust II | CIT | $19.8B | 633 |
Why
The reason is structural. Vanguard splits its trust assets across several separate trusts (Trust I, Trust II, Trust Select) with different pricing tiers, so no single Vanguard trust reaches T. Rowe's size. T. Rowe concentrates each vintage in one trust.
How we can tell
Plans name the same fund in many different ways on their filings: each of the T. Rowe trusts above appears under 6 to 8 different spellings. Because CITs don't have the SEC identifiers mutual funds do, we identify each trust by the EIN and plan number it files under on Schedule D, then add up every holding of it. Grouping by name alone splits these funds into many smaller pieces, which is why this ranking is hard to find elsewhere.
About the data
Figures cover 401(k) plans with more than 100 participants that list their holdings on Schedule H of Form 5500, for plan year 2024 (52,763 plans). Dollars are the plans' holdings in mutual funds, collective investment trusts (CITs) and pooled separate accounts on the Schedule of Assets Held.
Every plan, fund and manager behind these numbers is in Axiomatic Plan Intelligence. For more information, email us at info@axiomaticdata.com.
Updated November 2026 with figures from the latest complete plan year (2024). The original LinkedIn post used an earlier version of our data, so some numbers differ.
Originally posted on LinkedIn.
State Street vs American Funds: Two Different Target-Date Businesses
https://staging.axiomaticdata.com/blogPosts/state-street-vs-american-funds-401-k-market-strategies
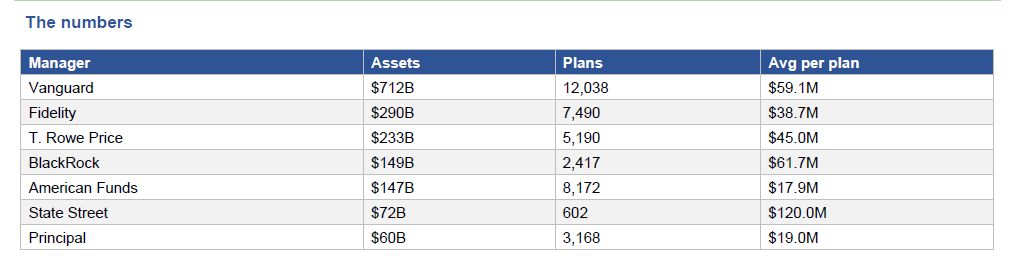
Ranking managers by assets hides a more interesting fact: they aren't competing for the same customers. In large 401(k) plans, State Street manages $134 billion of target-date money across 380 plans, about $352 million per plan. American Funds manages $114 billion across 6,270 plans, about $18 million per plan. That is 16 times the reach for slightly less money.
Where each firm's plans sit
| Plan assets | State Street plans | State Street dollars | American Funds plans | American Funds dollars |
|---|---|---|---|---|
| Under $25M | 68 | Under $1B | 3,846 | $20B |
| $25M to $100M | 88 | $3B | 1,858 | $35B |
| $100M to $250M | 49 | $4B | 386 | $24B |
| $250M to $1B | 96 | $21B | 165 | $28B |
| Over $1B | 79 | $105B | 15 | $7B |
78% of State Street's target-date money is in 79 plans with more than $1 billion each. 61% of American Funds' plans have less than $25 million.
Two business models
State Street sells index target-date strategies as collective trusts (100% of its target-date money here), usually through institutional consultants to the largest employers. American Funds sells actively managed mutual fund series (virtually none in trusts), distributed through financial advisers to small and mid-sized employers. A league table by assets makes them look like rivals. In practice, they barely meet.
About the data
Figures cover 401(k) plans with more than 100 participants that list their holdings on Schedule H of Form 5500, for plan year 2024 (52,763 plans). Dollars are the plans' holdings in mutual funds, collective investment trusts (CITs) and pooled separate accounts on the Schedule of Assets Held.
Every plan, fund and manager behind these numbers is in Axiomatic Plan Intelligence. For more information, email us at info@axiomaticdata.com.
Updated November 2026 with figures from the latest complete plan year (2024). The original LinkedIn post used an earlier version of our data, so some numbers differ.
Originally posted on LinkedIn.
Vanguard Dominates US Target-Date Money Management
https://staging.axiomaticdata.com/blogPosts/vanguard-dominates-us-target-date-money-management
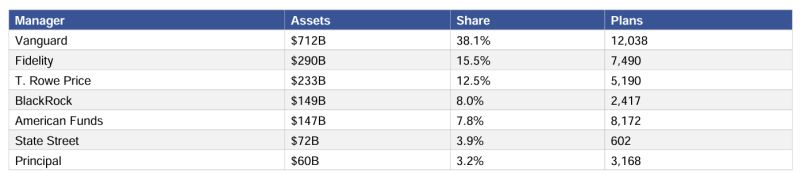
Target-date is among the most concentrated businesses in asset management. Inside large 401(k) plans, Vanguard alone manages 39% of target-date money, more than the next two competitors combined, and the top three control about two-thirds of $2.36 trillion.
| Manager | Target-date dollars | Share | Plans | Share in CITs |
|---|---|---|---|---|
| Vanguard | $916B | 39% | 11,067 | 75% |
| Fidelity | $331B | 14% | 7,425 | 45% |
| T. Rowe Price | $291B | 12% | 4,633 | 78% |
| BlackRock | $235B | 10% | 2,033 | 88% |
| State Street | $134B | 6% | 380 | 100% |
| American Funds | $114B | 5% | 6,270 | 0% |
Why it is so concentrated
A target-date fund is a long-term choice. It is usually the plan's default, so switching means moving most participants' money at once, and committees rarely do that without a clear reason. Once a manager wins a plan, the assets tend to stay and grow with every paycheck. Scale also lowers costs, which helps the largest index-based series win new plans.
Beyond the top three
Below the top three, the managers split by the kind of plan they serve. BlackRock and State Street sell mostly trusts to large plans, while American Funds sells mutual funds to thousands of smaller ones. For anyone selling into or competing with this market, three relationships determine most of the flow, and the rest of the market is segmented by plan size.
About the data
Figures cover 401(k) plans with more than 100 participants that list their holdings on Schedule H of Form 5500, for plan year 2024 (52,763 plans). Dollars are the plans' holdings in mutual funds, collective investment trusts (CITs) and pooled separate accounts on the Schedule of Assets Held.
Every plan, fund and manager behind these numbers is in Axiomatic Plan Intelligence. For more information, email us at info@axiomaticdata.com.
Updated November 2026 with figures from the latest complete plan year (2024). The original LinkedIn post used an earlier version of our data, so some numbers differ.
Originally posted on LinkedIn.
Target-Date Funds Concentrate in the 2030 to 2040 Cohorts
https://staging.axiomaticdata.com/blogPosts/target-date-funds-concentrate-in-2040-retirement-cohort
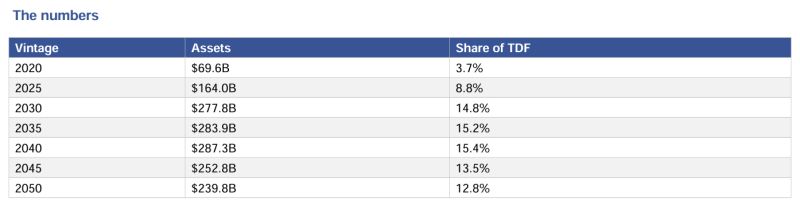
Target-date assets are not spread evenly across vintages. They pile up in a narrow band: the 2030, 2035 and 2040 funds hold $1.04 trillion, 44% of the $2.36 trillion in target-date funds inside large 401(k) plans.
| Target year | Target-date dollars | Share |
|---|---|---|
| 2010 to 2020 | $100B | 4% |
| 2025 | $192B | 8% |
| 2030 | $347B | 15% |
| 2035 | $348B | 15% |
| 2040 | $347B | 15% |
| 2045 | $314B | 13% |
| 2050 | $297B | 13% |
| 2055 to 2065 | $373B | 16% |
| Retirement income or unspecified | $38B | 2% |
Why the money sits there
Balances build with age. Savers in the 2030 to 2040 cohorts are roughly 45 to 60 years old: they have had decades of contributions and market growth, and are in their highest-earning years. Younger cohorts hold more accounts but smaller balances. Older cohorts are shrinking as people retire and roll money out of their plans.
Why it matters
That concentration locates the cohort whose glide path decisions are about to become real: people retiring in the next 5 to 15 years. These are the vintages where managers are shifting from growth to income, and where questions about retirement income products and private-market sleeves apply first. Any change in how the 2030 to 2040 funds are managed moves nearly three times more money than every vintage after 2050 combined ($373 billion).
About the data
Figures cover 401(k) plans with more than 100 participants that list their holdings on Schedule H of Form 5500, for plan year 2024 (52,763 plans). Dollars are the plans' holdings in mutual funds, collective investment trusts (CITs) and pooled separate accounts on the Schedule of Assets Held.
Every plan, fund and manager behind these numbers is in Axiomatic Plan Intelligence. For more information, email us at info@axiomaticdata.com.
Updated November 2026 with figures from the latest complete plan year (2024). The original LinkedIn post used an earlier version of our data, so some numbers differ.
Originally posted on LinkedIn.
86% of Large 401(k) Plans Hold a Target-Date Fund
https://staging.axiomaticdata.com/blogPosts/most-us-401-k-plans-hold-target-date-funds

The single most important fact about how Americans invest for retirement is that most of them don't choose. Target-date funds are the default investment in most large 401(k) plans, and the default has won: 45,280 of 52,763 large plans (86%) hold one, and they account for $2.36 trillion, more than a third (37%) of every fund dollar in those plans.
Every size of plan uses them
| Plan assets | Plans | Share holding a target-date fund |
|---|---|---|
| Under $25M | 30,742 | 85% |
| $25M to $100M | 14,531 | 87% |
| $100M to $250M | 3,835 | 88% |
| $250M to $1B | 2,513 | 89% |
| Over $1B | 1,142 | 87% |
Almost nothing else about 401(k) investing is this uniform. Fund vehicles, managers and fees all vary sharply with plan size; the decision to use a target-date fund doesn't.
Why the default won
The Pension Protection Act of 2006 let plans automatically enroll workers and invest them in a "qualified default investment alternative" with fiduciary protection. Target-date funds became the standard choice, because one fund handles the whole glide path from aggressive to conservative as the saver ages. Automatic enrollment then sends a steady stream of new contributions straight into them.
Why fund-level data matters here
These figures come from the fund-level holdings plans file on Form 5500 Schedule H. Much of that detail arrives as attached PDFs that few data providers parse, which is why most public figures on target-date use come from surveys of a few hundred plans, not from the filings themselves.
About the data
Figures cover 401(k) plans with more than 100 participants that list their holdings on Schedule H of Form 5500, for plan year 2024 (52,763 plans). Dollars are the plans' holdings in mutual funds, collective investment trusts (CITs) and pooled separate accounts on the Schedule of Assets Held.
Every plan, fund and manager behind these numbers is in Axiomatic Plan Intelligence. For more information, email us at info@axiomaticdata.com.
Updated November 2026 with figures from the latest complete plan year (2024). The original LinkedIn post used an earlier version of our data, so some numbers differ.
Originally posted on LinkedIn.
Collective Trusts Hold More 401(k) Money Than Mutual Funds
https://staging.axiomaticdata.com/blogPosts/collective-trusts-hold-more-money-than-mutual-funds
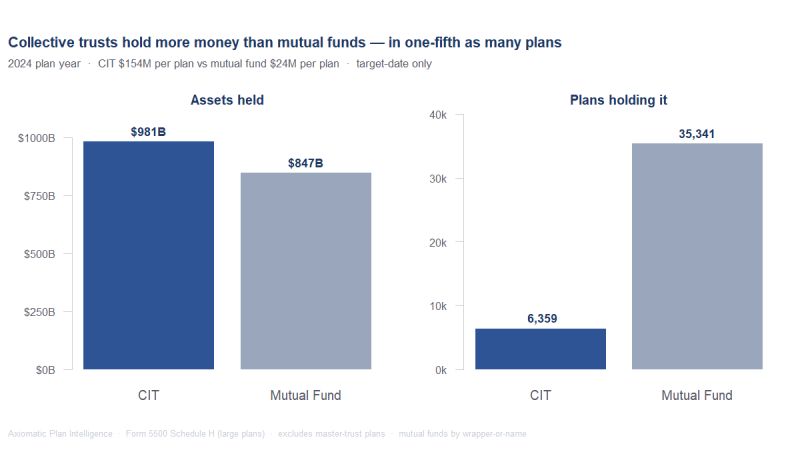
Inside large 401(k) plans, collective investment trusts (CITs) now hold more money than mutual funds, and they do it in far fewer plans.
| Vehicle | Plans holding it | Dollars | Share of fund dollars | Average per holding plan |
|---|---|---|---|---|
| Collective trusts | 27,203 | $3.73T | 58% | $137M |
| Mutual funds | 46,535 | $2.47T | 39% | $53M |
| Pooled separate accounts | 12,112 | $0.22T | 3% | $18M |
It's a plan-size question
| Plan assets | Plans | CIT share of fund dollars |
|---|---|---|
| Under $25M | 30,742 | 11% |
| $25M to $100M | 14,531 | 14% |
| $100M to $250M | 3,835 | 22% |
| $250M to $1B | 2,513 | 43% |
| Over $1B | 1,142 | 79% |
The "trust versus mutual fund" question is really a question about plan size. A CIT is an institutional product: a bank-maintained pool that can offer lower, negotiated fees and is regulated by banking authorities rather than registered with the SEC. Large plans have the scale to negotiate those terms and the consultants to review them. Smaller plans mostly buy what their recordkeeper's platform offers, which is often a mutual fund lineup.
Why it matters
Because the largest plans hold most of the money, the vehicle they choose sets the market's direction. Managers building new products for 401(k)s, including alternatives sleeves, increasingly launch them as trusts first. Mutual funds remain the way most plans, by count, invest.
About the data
Figures cover 401(k) plans with more than 100 participants that list their holdings on Schedule H of Form 5500, for plan year 2024 (52,763 plans). Dollars are the plans' holdings in mutual funds, collective investment trusts (CITs) and pooled separate accounts on the Schedule of Assets Held.
Every plan, fund and manager behind these numbers is in Axiomatic Plan Intelligence. For more information, email us at info@axiomaticdata.com.
Updated November 2026 with figures from the latest complete plan year (2024). The original LinkedIn post used an earlier version of our data, so some numbers differ.
Originally posted on LinkedIn.
Collective Trusts Dominate Target-Date Money at Every Age
https://staging.axiomaticdata.com/blogPosts/collective-trusts-dominate-younger-target-date-funds
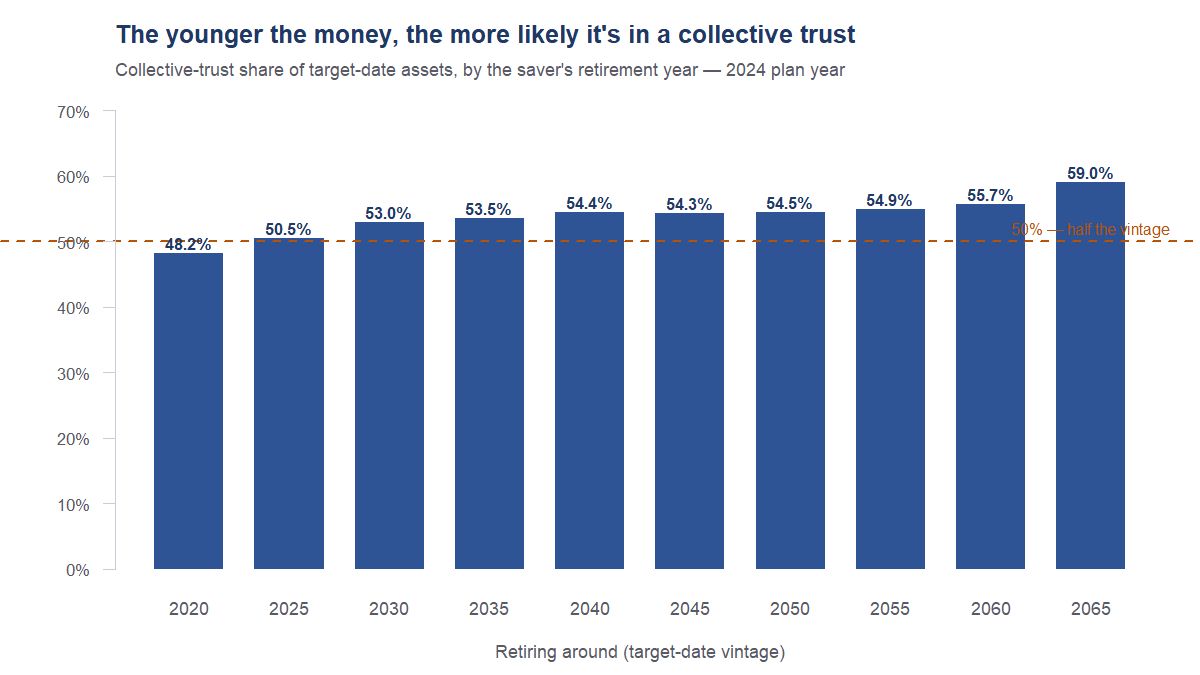
Target-date funds hold $2.36 trillion inside large 401(k) plans, and 69% of it sits in collective investment trusts (CITs). Sorting that money by the year its savers expect to retire shows where the trust wrapper has taken hold, and where it hasn't.
The gradient
| Target year | Target-date dollars | Share in CITs |
|---|---|---|
| 2010 | $6B | 53% |
| 2015 | $11B | 62% |
| 2020 | $83B | 67% |
| 2025 | $192B | 67% |
| 2030 | $347B | 68% |
| 2035 | $348B | 69% |
| 2040 | $347B | 69% |
| 2045 | $314B | 70% |
| 2050 | $297B | 69% |
| 2055 | $215B | 69% |
| 2060 | $123B | 68% |
| 2065 | $35B | 70% |
The money retiring soonest is the least likely to be in a trust: just over half of the 2010 vintage. From the 2020 vintage on, the CIT share is essentially flat at 67% to 70%.
Why the oldest money lags
The 2010 and 2015 vintages hold money that was invested years ago, often in mutual fund series a plan chose before it moved its default to a trust, and these vintages are shrinking as savers retire and roll over. New contributions flow to the vintages further out, and those are mostly in the wrapper plans use today. In other words, the gradient is mostly a picture of the past: the trust became the standard target-date vehicle, and the remaining mutual fund money is concentrated where new money no longer arrives.
Size explains far more than age
The bigger difference is plan size. CITs hold 14% of target-date money in plans under $25 million, 31% in plans of $100 million to $250 million, 66% in plans of $250 million to $1 billion, and 93% in plans over $1 billion. A participant's retirement year moves the CIT share by a few points; their employer's plan size moves it by eighty.
About the data
Figures cover 401(k) plans with more than 100 participants that list their holdings on Schedule H of Form 5500, for plan year 2024 (52,763 plans). Dollars are the plans' holdings in mutual funds, collective investment trusts (CITs) and pooled separate accounts on the Schedule of Assets Held.
Every plan, fund and manager behind these numbers is in Axiomatic Plan Intelligence. For more information, email us at info@axiomaticdata.com.
Updated November 2026 with figures from the latest complete plan year (2024). The original LinkedIn post used an earlier version of our data, so some numbers differ.
Originally posted on LinkedIn.
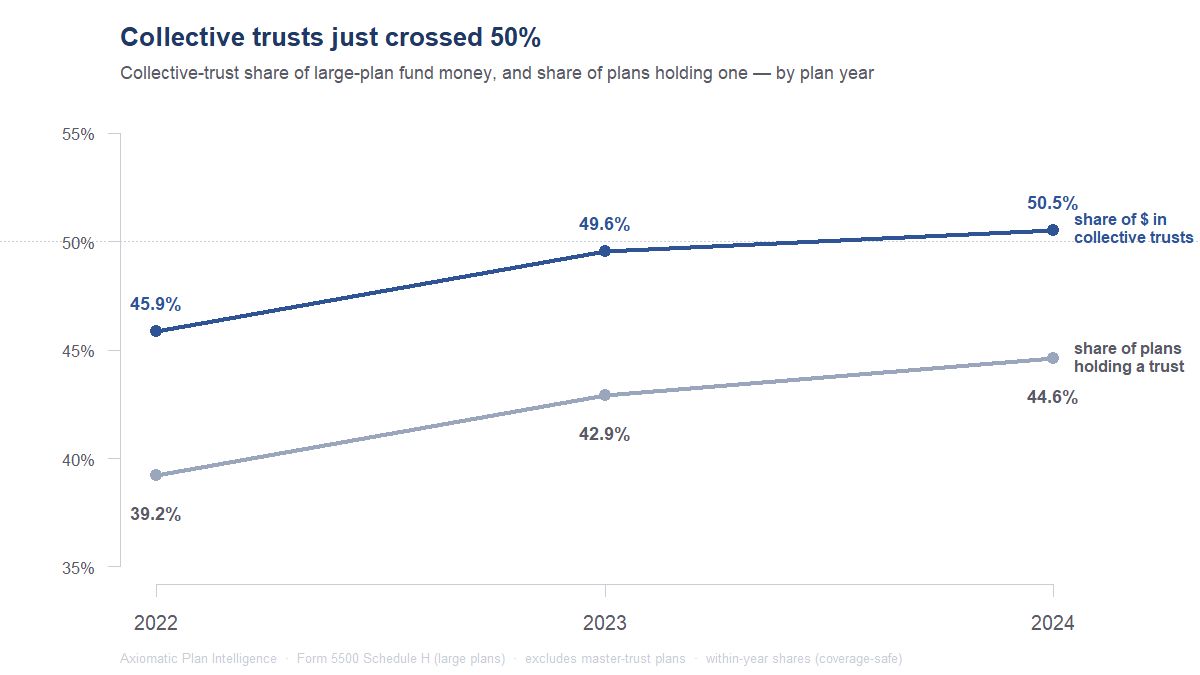
In large 401(k)s, most fund money is now in a collective trust.
A collective investment trust is the same kind of pooled fund as a mutual fund, but sold only to retirement plans — no ticker, no price in the paper, usually cheaper. A decade ago it was a niche institutional wrapper. Today, in large plans, there’s a dollar in a trust for every dollar in a mutual fund.
And in the fastest-growing corner — target-date funds — the trust has already pulled ahead.
Consolidation vs. Creation: The Counter-Narrative in Professional Services
This month's Axiomatic Form 5500 data (November 2025) provides a necessary counterpoint to this consensus, pointing to a parallel trend of small firm creation. While consolidation certainly persists, the F5500 filings, which track the formation of new employee benefit plans, reveal a hidden boom in new professional entities.
Our data shows the largest net increases in active companies this month across three key sectors:

The data suggests a strong element of fragmentation is offsetting the merger activity. Professionals may be seeking greater autonomy, enabled by technology (like AI legal tech and cloud-based practice management) that lowers the barrier to starting an independent firm.
Nuancing the Trends
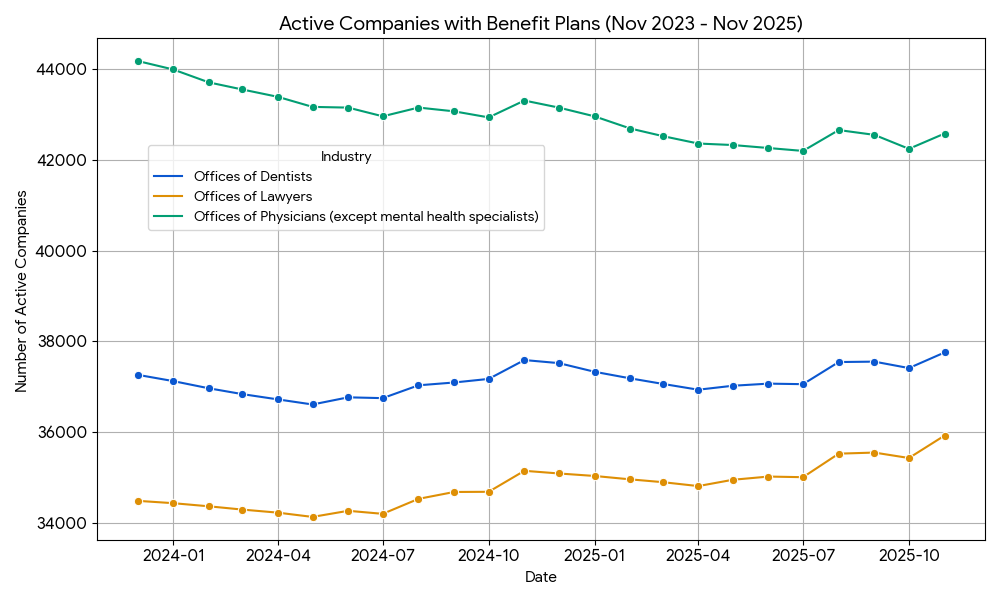
The chart below, which tracks the total number of active companies (Form 5500 filers) over the past two years, adds necessary nuance:
We see a divergence in professional services: Lawyers and Dentists show sustained net growth in company count, proving that formation is beating consolidation. For Physicians, the long-term trend aligns with media reports on consolidation (e.g., Becker's ASC Review's report that nearly half of U.S. physicians were hospital employees by 2024), showing a net decline of approximately 1,600 entities since late 2023. Nevertheless, the addition of 338 net new physician companies in November 2025 suggests a recent, albeit small, revival of independent practice activity.
Investment Thesis and Data Utility
This duality—consolidation coexisting with creation—presents a bifurcated investment opportunity. While consolidation targets large-scale M&A, the fragmentation trend points toward reliable investment in the "picks and shovels" that service this burgeoning base of small firms (e.g., specialized software, cloud-based services, and focused suppliers).
Axiomatic’s Form 5500 data is unique because it offers a ground-truth, bottom-up view of company formation and employment, directly tracking the establishment of benefit plans. This level of granular, non-survey-based insight allows investors to spot nascent trends.